

Facteus for Investors
Alternative data that survives the backtest.
Most alternative data is either fast and hard to audit, or credible and already priced in. Facteus gives you decision-grade economic intelligence that’s both. You get a daily read on how 200M+ U.S. consumer cardholders actually spend for a point-in-time, backtestable signal. And we check our work every day against the government’s numbers and reported earnings, because when the market moves fast, you need to, too.
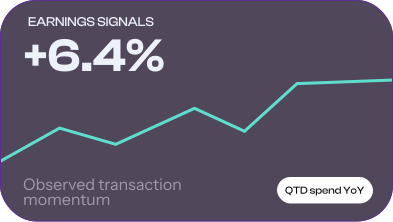
For investors, at a glance
4,000+
Companies
Public and private, already ticker-mapped. Skip the weeks of mapping.
48 of 50
States
Within 2 percentage points of BEA Personal Consumption Expenditures (PCE) spending share. Representativeness you can check.
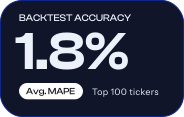
1.8%
Average MAPE
Mean absolute percentage error vs. reported earnings, top 100 tickers. Lower is better.
1 day
Lag
Spending lands the day after it happens, refreshed daily.
You’ve probably been sold alternative data before. Here’s usually where it falls apart.
One signal, from the whole economy to a single ticker.
Same data, same validation, at whatever altitude your question needs.
Read the economy before the print.

Chroma
Spend Insights
See real consumer spending nationally and by sector, category, and company – all from a single signal. It’s continually benchmarked against BEA Personal Consumption Expenditures (PCE) and the Census Monthly Retail Trade Survey (MARTS), so speed doesn’t cost you trust.
Facteus ChromaWalk into earnings already knowing.

Beacon
Forecasting Signal
Track revenue direction, benchmark peers, and spot inflections ahead of earnings. Our signal is scored against company-reported results, including 1.8% MAPE for the top 100 tickers.
Facteus BeaconModel at the individual transaction level.

Spectrum
Transaction Stream
Build your models with point-in-time, extractable transactions delivered by API, Snowflake or S3. So your team spends Monday modeling, not mapping.
Facteus SpectrumSee the shelf before the quarter closes.

Acuity
Product Granularity
Get visibility into product-level sales from 45K stores across hardline and softline categories, so you can track velocity and trade-down in real-time.
Facteus AcuityFast is easy.
Defensible is the job.
48 of 50
states within 2 pp of BEA PCE share
92%
average correlation with Census Monthly Retail Sales
1.8%
average MAPE vs. reported earnings for top 100 tickers
85%
of data on 1-day lag, 5-day full fill
Transaction data earned its place in investment research because it reads demand directly, not through a survey or proxy. But when real capital rides on a number, “directionally useful” isn’t the bar.
Alternative data has to be point-in-time, backtestable, representative, and explainable – and it has to hold up against macro benchmarks, reported earnings, and your own model’s scrutiny. It also needs to have comprehensive ticker coverage across retail, restaurant, gas & convenience, and other major industries.
Most panels get checked against themselves. We check ours against the economy itself. Every day, we backtest and recalibrate against the latest government and earnings data, so the same signal can help a macro team read the consumer cycle, an analyst test a variant view, or a quant team feed production models inputs that compliance can audit.
Facteus comes from 18+ direct banking, financial services, and fintech partners covering 200M+ active U.S. credit and debit cards. Collection is passive: no app to opt in to, no receipt to scan, and no survey to remember. That means less opt-in bias, less recall error, and less digital-first skew.
See how we validateWhat investors do with Facteus
Industries We Serve
Built for the industries you
trade on.
Test our data in your models before trading on it.
Connect with our team to explore a sample cut and judge the coverage, methodology, and audit trail for yourself.
Book a demo