Decision-Grade Intelligence for Restaurants

See the restaurant market your POS can’t, down to the store level.

Your POS tells you what happened in your restaurants. Facteus tells you what happened in everyone else’s. The day after it happens.

See named competitor performance, market-share shifts, trade-area demand, and verified guest behavior through transaction intelligence built from 200M+ U.S. consumer cards – delivered daily and validated against trusted economic benchmarks.

Restaurant performance is never just one number.

A comp tells you where you landed. But it can’t tell you why. What’s useful is understanding what moved underneath it.

The category

Is restaurant demand growing, slowing, or shifting between segments?

The competition

Which brands are gaining share, visits, or wallet? And where?

The guest

Are guests visiting less, spending more, switching brands, or leaving the category? And do they differ by cohort?

The market

Is the trend national, regional, or concentrated around a handful of stores?

The best restaurant sales data connects all these views for you so you don’t need five tools to get the full story.

Teams We Serve

One total market view for every team looking at the business.

One signal, pointed at the question your team owns.

Strategy Teams

Know where the real opportunity is.

Compare market demand, share movement, competitor performance, and store-level trends before entering a market, opening another location, or changing the portfolio.

Facteus for Strategy Teams

Finance Teams

Explain the variance. Strengthen the forecast.

Use restaurant sales data to put comps, transactions, and average ticket in context. See whether a miss reflects your business, the category, a specific market, or competitive pressure.

Facteus for Finance Teams

Marketing Teams

Understand what changed with the guest.

Track frequency, cross-shopping, wallet movement, and promotion-period behavior. Find lapsed guests and competitive buyers for smarter acquisition and re-engagement.

Facteus for Marketing Teams

Analytics Teams

Connect your numbers to the market around you.

Bring external restaurant, competitor, customer, and geographic signals into your dashboards, models, and reporting.

Facteus for Analytics Teams

A few questions Facteus restaurant sales data can answer.

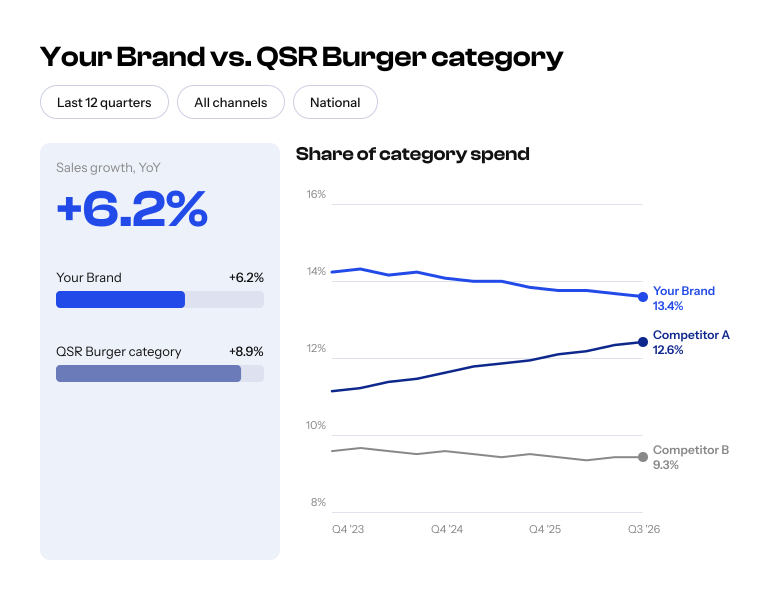
Your brand is growing. But are you gaining share?

Compare spend and transaction trends against the category and named competitors to see whether growth is actually outperforming the market.

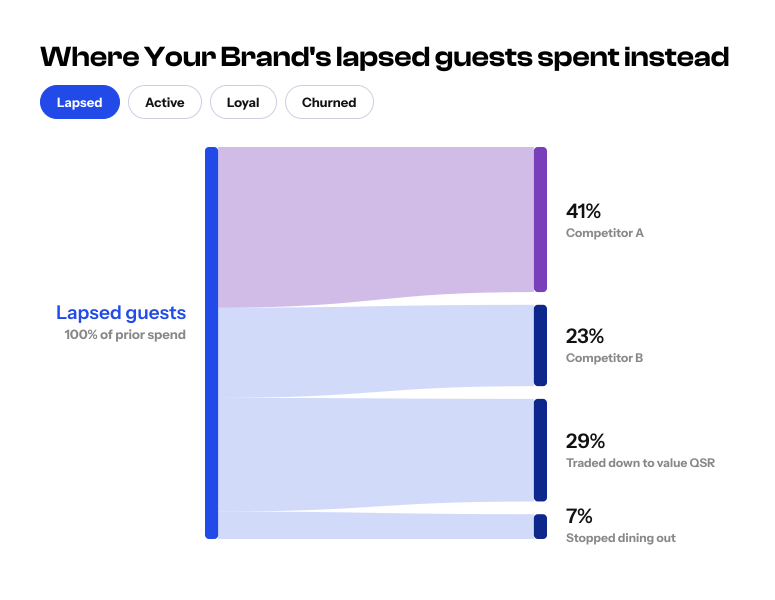
Guests are disappearing. Where are they going?

Follow cross-shopping and wallet movement to see whether lapsed diners switched to a competitor, traded down, or simply reduced their restaurant spend.

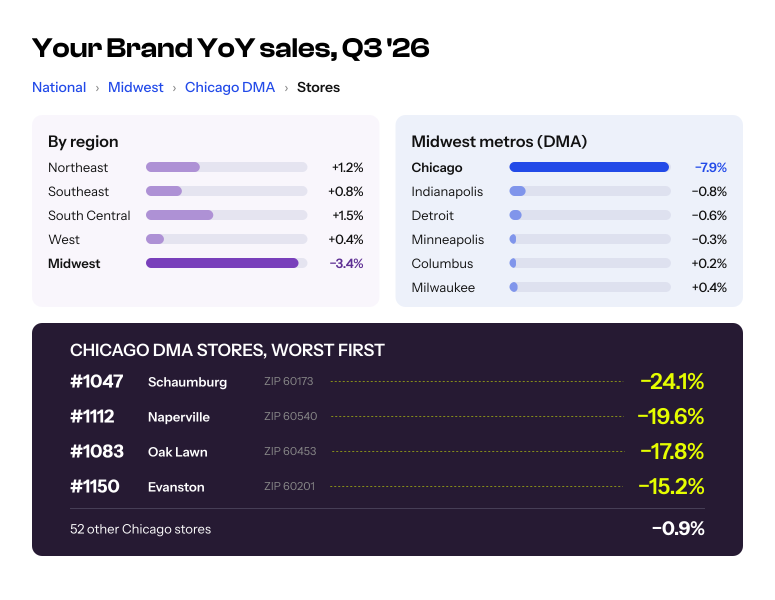
Your Midwest sales missed. Is it a regional problem or a handful of problem stores?

Zoom from national performance into metros, ZIPs, and individual stores to find where weakness is actually concentrated.

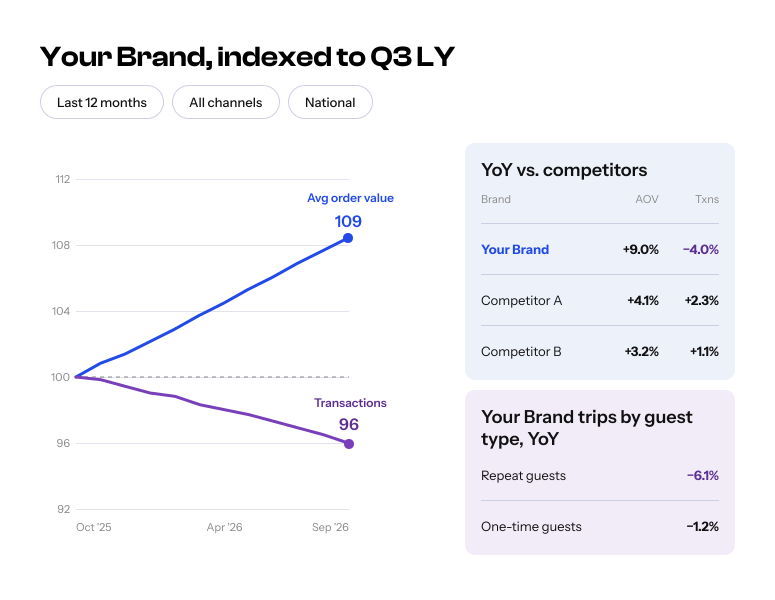
Guest checks are up. Is demand actually stronger?

Look at average order value (AOV) alongside transactions and customer behaviors – and then compare it to your competitors.
Ask the restaurant questions. Get your answers in seconds.

When the question comes in a meeting: “Why are we underperforming this quarter?”, Ask Facteus and get an immediate answer grounded in real-time restaurant sales data.

Then keep going. Which competitors are gaining? Is the whole category soft? Which markets are driving the gap? Where are lapsed guests spending instead?

Go from the first question to the market, competitor, guest, or share behind it before the meeting ends.

Interactive Demo

Bring us your restaurant numbers you can’t explain.

A comp that doesn’t match the category. A competitor gaining faster than expected. A market behaving differently than the rest.

We’ll show you what the transactions say.
Book a demo

Frequently Asked Questions

What can Facteus restaurant sales data show?

Facteus can help teams analyze consumer spend, transactions, average order value, market share, competitor performance, customer overlap, wallet movement, geography, daypart, day of week, and store-level trends for covered restaurant brands.

Can we benchmark specific restaurant competitors?

Yes. You can compare named restaurant brands across spend, transactions, average order value, share, geography, and other metrics.

Can Facteus show where lapsed guests go?

Facteus can analyze cross-shopping and wallet migration to help show how consumers shift spend between restaurant brands or away from the category.

How granular is the data?

Facteus can move from national and category-level restaurant trends into regional, MSA, ZIP, and store-level views for covered brands.

Can Facteus support site selection?

Yes. Teams can use consumer demand, competitive performance, and location-level intelligence alongside existing real estate inputs when evaluating expansion opportunities.

How fresh is the data?

Facteus data begins arriving the day after transactions occur, with 85% available on a 1-day lag and full fill typically reached within five days.

Can we use the data in our own tools?

Yes. Depending on the Facteus product, teams can work through natural-language analysis, dashboards, Snowflake, S3, API, and other approved workflows.

Texas Data Broker Notice

The entity maintaining this website is a data broker under Texas law. To conduct business in Texas, a data broker must register with the Texas Secretary of State (Texas SOS). Information about data broker registrants is available on the Texas SOS website.