Facteus For Investors
Stay ahead of the market with a 1‑day delay on transaction data covering $1.6 trillion in annual spend.
Discover consumer demand shifts in near real time, before they hit income statements.
Evaluate brand momentum vs. competitors in real dollars and transactions
Ingest near-real-time spend data directly into long/short trading models and strategies
Leverage granular data to forecast revenue and margin related KPIs
Monitor transaction sizes to gauge revenue quality
Track the inputs into earnings and consensus revisions before they are priced in
Build, test, and refine predictive models using historical and daily data feeds
Black Friday 2025 Sales Data
With delay of just 1 day, investors have faster access to sales data for key retail events.
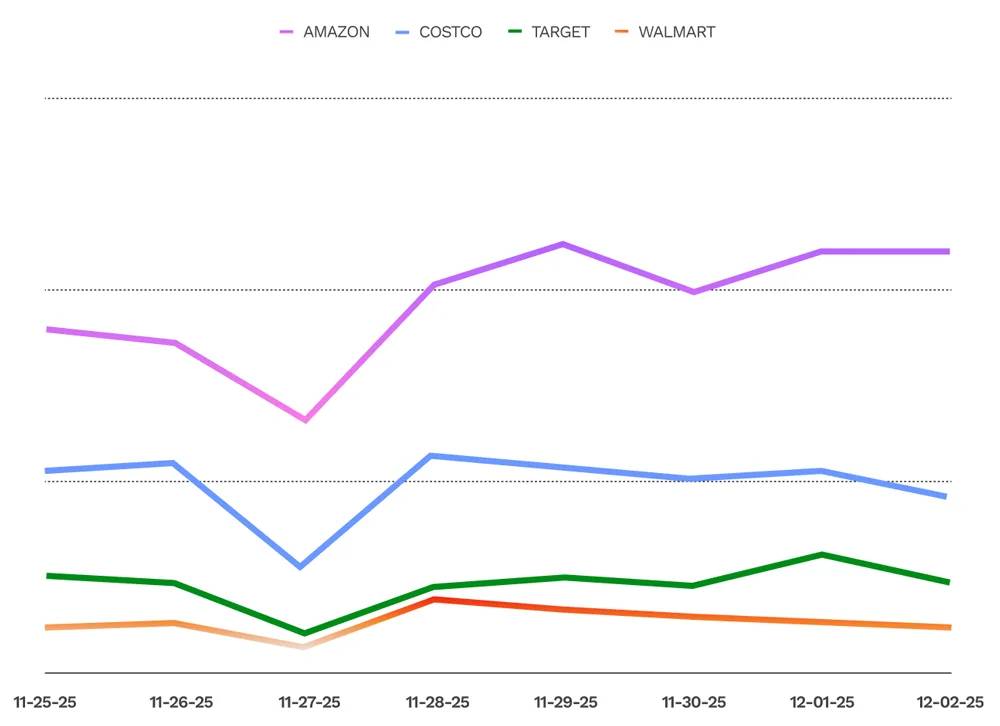
Explore the complete sales data from these retailers and more in a live demo.
Products for Fundamental Investors:
Fundamentals
Research Dashboard
Ready-to-use visualizations of key transaction data use cases drive faster decisions. No downloads, engineers, or data scientists required.
Screening Tools: Bolster idea generation by identifying the biggest gaps between consensus and reality
Quarterly KPI Forecasts: Improve financial modeling with pre-built KPI forecasts, or take the data with you to plug in to your existing model
QTD Spend Trends: Track real-time consumer demand shifts before they hit income statements
Macroeconomic Data: Get an early read on industry level data with trends mapped directly to the Census MARTS report
Brand Market Share: Deep dive into the competitive situations
Holiday Shopping Comparisons: Utilize the fastest data in market to get the first look at high-impact sales periods
The largest investors in the world trust Facteus for alpha generation in their trading decisions.
Products for
Quantitative Investors:
Arbiter
Make accurate, real-time predictions with the most balanced and representative consumer transaction panel on the market.
- Top Forecasting Accuracy: >98 KPI YoY Accuracy for Top 100 Tickers
- 1 Day Lag Sources: 100% Fill Rate
- Exclusive alternative debit cards: For socio-economically balanced data
Merchants
3,300+
Cards
6.5M
Tickers
653
Lookback
4 year
Feature Comparison
Other Alt. Datasets
Facteus Arbiter 2.0
Exclusive sources
Complete coverage of US consumer demographics
Top 100 MAPEs
2%+
<2%
Card Type, Channel , State Breakouts
Lag
3-5 Days
1 Day
Available via Snowflake, S3, and more.
Ultra
Row-level transaction data stream representing the largest, fastest and most complete consumer transaction dataset available.
- Predictive: The most statistically significant consumer transaction dataset
- Massive: Unmatched geographic, generational, and socioeconomically representative panel
- Row-Level: For granular consumer spending analysis
Merchants
3,000+
Cards
120M
Tickers
840+
Monthly
Transactions
1.5B
Lookback
8 year
Feature Comparison
Receipt Panels
Other Alt. Datasets
Facteus Ultra
Full Card Capture of
Transactions
Exclusive Sources
Annual Spend
$5B
$150B
$1.6T
Active Cardholders
1,000+
100M
185M
Transaction Level
Lag
5 Days
3 Days
1 Day
Full Fill
7 Days
10 Days
4 Days
Available via Snowflake, S3, and more
Onyx
Access the largest consistent capture of product SKU‑level sales data covering hardline and softline companies in the United States.
Frictionless quant investor backtesting is available with easy, ticker-level ingestion across Snowflake, S3, or any other platform.
Data is available pre-aggregated or in row-level format.
Categories and Tickers include:
- Home Improvement: ITW, SWK, HON, WHR, WDFC, RPM
- Apparel: DECK, SKX, TPR, CROX, SHOO, LEVI, PVH, HBI
- Sporting Goods: GOLF, NIKE, MODG, COLM, UAA
- Big Box Retail: ROKU, YETI, HNST
- Pet Care: CENT
- CPG: PG, KO, CHD, SMPL
Annual Spend
$400B
UPCs
2.2M
Stores
20k
Tickers
137
Lookback
5 year
Feature Comparison
Receipt Panels
Other Alt. Datasets
Facteus Onyx
Full Store Capture of
Transactions
Consistent Data
Contributors
Exclusive Sources
Annual Spend
$5B
$150B
$400B
Aggregated
Lag
5 Days
3 Days
1 Day
Full Fill
7 Days
10 Days
4 Days
Available via Snowflake, S3, and more