Skip to content
Cyber Five, Called in Advance: How Our Predictions Stacked Up Against Real Spend

Before Black Friday dropped, we made four predictions about how holiday shopping would unfold in the biggest shopping weekend of 2025. Now that the transaction data is in, let’s take a look and see how we did.
While other outlets are recapping “online was up X%, traffic was Y,” we’re doing something different: showing you exactly how our predictions matched reality – down to the dollar, the category, and the day.
Here’s our scorecard:
Prediction #1: Earlier, More Strategic Spend Would Pull Volume Forward
The Call: We predicted shoppers would start holiday spending earlier, with October promotions pulling share away from traditional Cyber Five. The logic? Retailers launched deals earlier to compete, and budget-conscious consumers would spread spending across weeks rather than concentrate it into one weekend.
The Verdict: CONFIRMED – and it was massive!
October wasn’t just “active” – it was structurally significant. Our data shows that October daily transaction volume captured 72% of Cyber Five’s daily pace. Let that sink in. Nearly three-quarters of Cyber Five’s intensity was already happening in October.
Breaking it down by category reveals even more:
- Nonstore retailers (DTC brands, digital marketplaces): October daily spend reached 80% of Cyber Five levels
- General merchandise: October captured 69% of Cyber Five daily spend
- Furniture: October hit 64% of Cyber Five intensity
The early-bird strategy worked. Shoppers didn’t wait for Black Friday to spend – they’d already been buying for weeks. October wasn’t a warm-up; it was a full-blown parallel shopping season.
The Implication: If your promotional calendar still treats October as “pre-season,” you’re behind. October is the season now.
Prediction #2: Big-Ticket Categories Would Outperform
The Call: We expected higher-ticket categories – electronics, furniture, home goods – to see stronger AOV growth during Cyber Five as consumers focused promotional budgets on considered purchases rather than impulse buys.
The Verdict: CONFIRMED – decisively.
While apparel AOV stayed flat (even dipping slightly from $105 to $103), big-ticket categories surged:
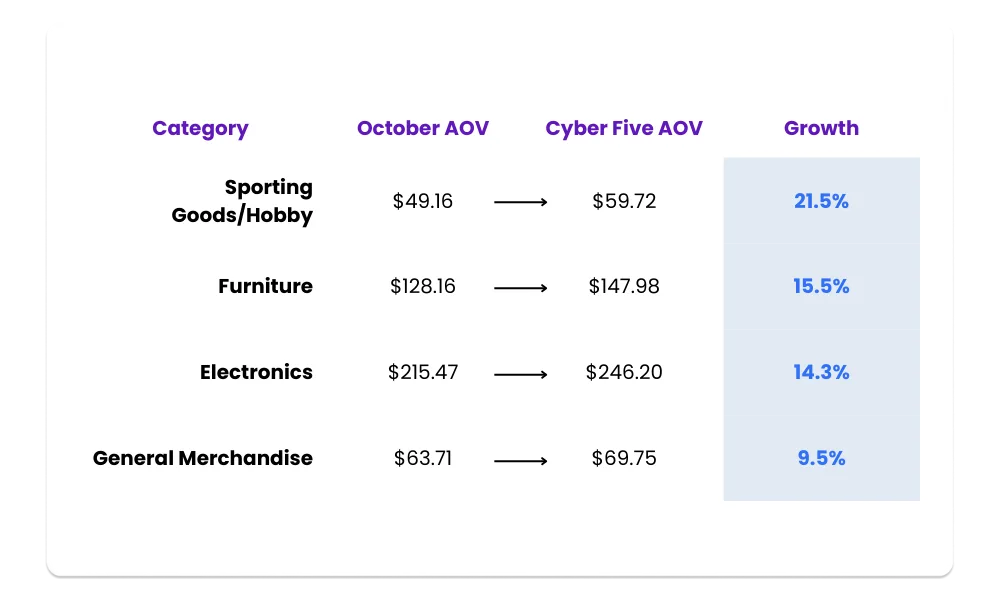
Sporting goods led the charge with a 21.5% AOV jump – think holiday gifts, outdoor equipment, and hobby items that consumers saved for promotional periods. Furniture climbed 15.5%, reflecting shoppers willing to make that big-ticket home purchase only when the discount justified it.
But here’s the kicker: sporting goods didn’t just grow AOV – they also claimed 25% of total Cyber Five spend, the second-largest share after general merchandise. This wasn’t just a few high rollers buying expensive items. This was volume and value.
The Implication: High-ticket doesn’t necessarily mean low-volume. Consumers will spend big when the value equation makes sense – but they’re doing it strategically, not impulsively.
Prediction #3: Intensified Value-Seeking & Cross-Retailer Churn
The Call: We predicted shoppers would aggressively comparison-shop, gravitating toward value-oriented channels and low-AOV, high-frequency categories. The theory: inflation-weary consumers would trade brand loyalty for better deals, driving growth in discount-heavy channels and general merchandise.
The Verdict: PARTIALLY CONFIRMED – but with a little nuance.
Value-seeking was real, but it didn’t manifest as pure “race to the bottom” behavior. Instead, we saw selective value-seeking paired with strategic upselling.
The Numbers:
- General merchandise (Walmart, Target, big-box retailers) posted +45.7% daily spend growth during Cyber Five vs. October
- Sporting goods surged +70.9% – explosive growth in a traditionally promotional category
- Nonstore retailers (marketplaces like Amazon, DTC brands) grew +24.9% — solid, but lagging traditional retail
Here’s the twist: while consumers flocked to general merchandise stores for value, they weren’t just basket-stuffing with essentials. AOV in general merchandise climbed 9.5%, suggesting shoppers mixed staples with selective upgrades. The sporting goods explosion (21.5% AOV growth + 70.9% volume growth) points to consumers willing to spend on considered purchases – just at the right retailer, at the right time.
Nonstore retailers underperformed expectations. Despite the “digital-first” narrative, these channels posted the slowest growth rate during Cyber Five and maintained rock-bottom AOVs of $20.85. Translation? Shoppers used these channels for convenience and small purchases, but not for big holiday spending.
The Implication: Value-seeking didn’t mean consumers abandoned quality or ticket size – it meant they became more selective about where and when to deploy their dollars. Loyalty didn’t disappear altogether; it just became conditional.
Prediction #4: Cyber Monday Would Be the Seasonal Peak
The Call: We predicted Cyber Monday would claim the title of highest-spend day, driven by online shopping convenience, extended promotions, and last-chance urgency.
The Verdict: WRONG – and it wasn’t even close.
Black Friday crushed Cyber Monday across 5 of the 6 key Cyber Five categories (clothing, electronics, furniture, sporting goods, general merchandise, and nonstore retailers).
Here’s the day-by-day breakdown:
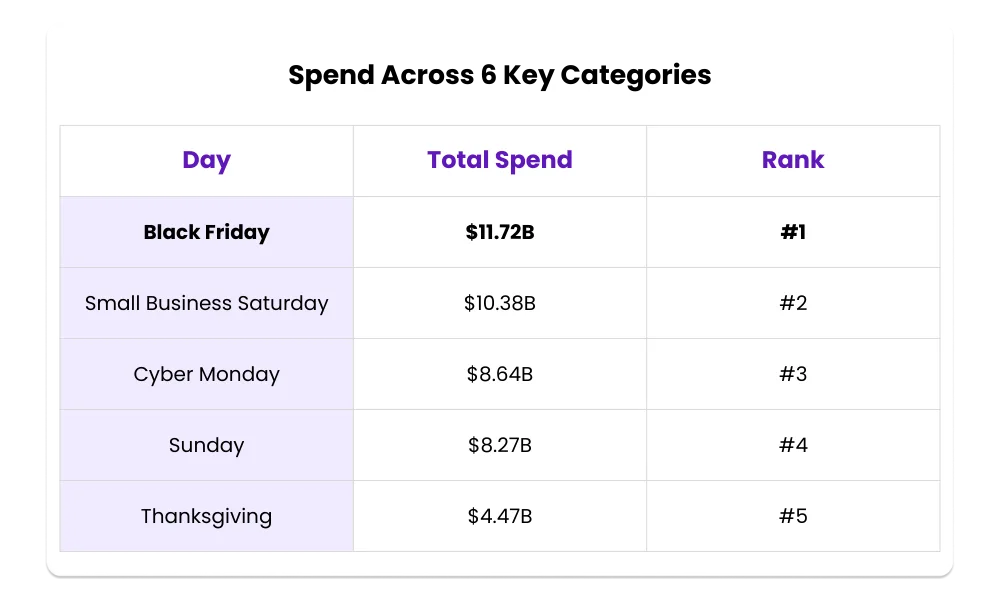
Black Friday wasn’t just first – it was 36% higher than Cyber Monday. And it wasn’t a fluke driven by a single category. Breaking down the Black Friday vs. Cyber Monday matchup by category:
- Clothing: Black Friday +49.5%
- Electronics: Black Friday +56.1%
- Furniture: Black Friday +41.2%
- Sporting Goods: Black Friday +13.6%
- General Merchandise: Black Friday +12.4%
The only category where Cyber Monday edged out Black Friday? Nonstore retailers – and even then, it was by a mere 0.7%. Basically a tie.
What happened? Black Friday’s in-store + online hybrid dominance is still intact. Despite years of “Cyber Monday is the new Black Friday” narratives, consumers still treat Black Friday as the tent-pole event. The urgency is higher. The deals feel bigger. The transaction volume and AOV both peaked on Friday.
Even more telling: Black Friday’s implied AOV of $78.08 far exceeded Cyber Monday’s $62.19. Shoppers weren’t just buying more on Friday – they were buying bigger.
The Implication: Reports of Black Friday’s death have been greatly exaggerated. It remains the gravitational center of holiday shopping, even in an increasingly digital world.
The Takeaway: Predictions Are Only as Good as the Data Behind Them
So what did we get right, and what did we miss?
Nailed it ✅
- Early season pull-forward (October was huge)
- Big-ticket AOV outperformance (sporting goods, furniture & electronics all surged)
- Value-seeking behavior (confirmed, but more nuanced than expected)
Missed the mark ❌
- Cyber Monday as the peak (Black Friday dominated decisively)
Three out of four isn’t bad – but more importantly, we can show you exactly why the data played out this way. That’s the difference between speculation and signal.
Other recaps will tell you “spending was strong” or “consumers were deal-focused.” We can tell you:
- October captured 72% of Cyber Five’s daily transaction intensity
- Sporting Goods AOV jumped 21.5% while claiming 25% of total spend
- Black Friday exceeded Cyber Monday by 36%, with higher AOV and volume across nearly every category
Why This Matters for 2026 Planning
If you’re building next year’s promotional calendar based on assumptions rather than transaction-level data, you’re flying blind. Here’s what the 2025 data tells us to watch for in 2026:
- October is no longer optional. If you’re launching promos on Black Friday, you’ve already missed a massive chunk of demand.
- Big-ticket categories respond to smart promotions. Consumers will spend on high-AOV items – but timing and channel matter.
- Black Friday still owns the weekend. Despite digital-first narratives, Friday remains the peak. Plan inventory, staffing, and ad creative accordingly.
- Value-seeking is selective, not desperate. Shoppers are sophisticated – they’ll comparison-shop, but they’re not just chasing the lowest price
Want to Inform & Validate Your Own Predictions?
We sliced the Cyber Five data by generation, income level, category, region, and day-of-week. Whether you’re trying to understand why your online sales spiked on Saturday instead of Monday, why Gen Z outperformed Boomers in certain categories, or how your vertical compared to broader retail trends – Facteus data can help.