What transaction data reveals about Walmart, Target, Costco, and Dollar General
Retail foot traffic shows which stores are attracting shoppers and where visits are increasing.
But showing up is not the same as spending.
A recent Placer.ai report named Costco and Dollar General among physical retail’s traffic leaders while describing Walmart’s visits as essentially flat. Facteus transaction data through June 2026 tells a very different story.
Foot traffic measures opportunity. Transaction data measures outcome.
Traffic cannot tell you whether a visit ended in a $130 basket, a single-item purchase, or no purchase at all. It cannot reveal whether conversion is improving, baskets are shrinking, or wallet share is shifting between competitors.
When the same four retailers are compared using observed card spend, the leaderboard nearly flips.
Data note: Spend, transaction, and average order value figures come from Facteus first-party transaction data covering June 2023 through June 2026. Visitation figures come from Placer.ai’s report, Physical Retail in 2026: How the Giants Are Winning, and are not Facteus data.
Costco is Winning Trips, but Losing Basket Momentum
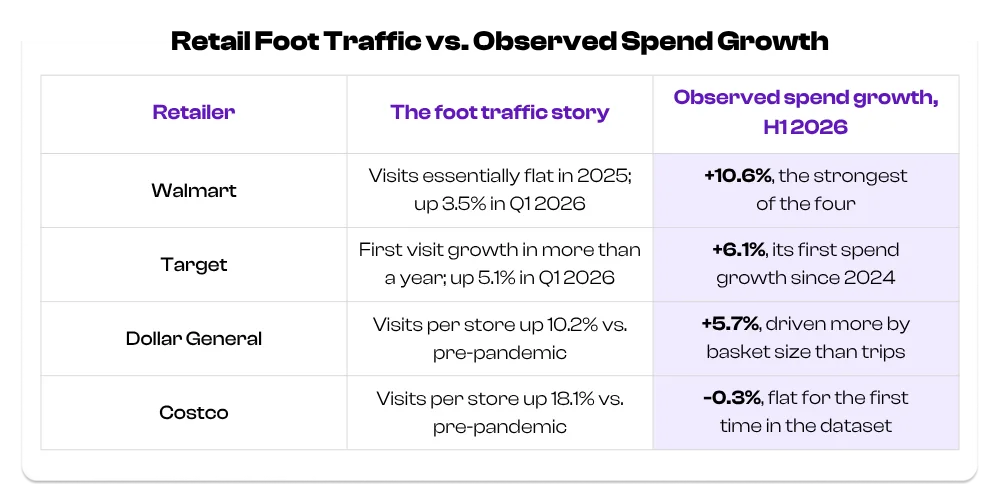
Costco is the traffic report’s standout, with visits per store up 18.1% from pre-pandemic levels.
The wallet tells a more nuanced story.
Costco’s observed spend growth has slowed in every quarter since mid-2024, falling from 14.2% in Q3 2024 to 0.9% in Q1 2026 before turning negative in Q2 at -1.5%. Transactions still grew 1.5% in Q2, but average order value fell 3.0%.
Members are still coming. They are simply putting less in the basket.
A generational shift may help explain why. In H1 2026, observed Costco spend from Gen Z grew 32%, while spend from Baby Boomers fell 4.0% and Gen X declined 3.8%. Costco is attracting younger shoppers, but those shoppers currently spend less per trip than the customers pulling back.
The traffic signal is strong. The spend momentum is not.
Walmart’s Flat Traffic Hid the Strongest Wallet
Placer.ai described Walmart’s visits as essentially flat in 2025, followed by a 3.5% increase in Q1 2026.
Facteus data shows what that traffic view missed. Observed Walmart spend grew 8.6% in 2025 and accelerated to 14.2% growth in Q1 2026. When you put the Q1 figures side-by-side:
Visits grew 3.5%. Observed spend grew 14.2%.
Transactions increased 9.2%, while average order value grew 4.6%, two outcomes a traffic counter cannot measure. The strength was broad-based. In H1 2026, Walmart spend increased in every region and across every generation.
Walmart may have had the quietest traffic story. But it had the strongest wallet story.
Target’s Traffic Recovery is Real, but the Basket is the Test
Target is where traffic and transaction data most clearly agree.
Visits grew 5.1% in Q1 2026, Target’s first increase in more than a year. Facteus data confirmed the recovery at the register: transactions increased 6.4%, and observed spend grew 7.7%.
It was Target’s first positive quarter after five consecutive declines. But Q2 revealed an important caveat: transactions grew 6.8%, while average order value fell 2.2%, moderating spend growth to 4.5%.
Shoppers have returned. Their baskets have not fully recovered.
That distinction will help determine whether Target’s turnaround is durable or still dependent on promotions and trip-driving activity. For the rest of 2026, the most important number may not be Target’s visit count. It may be the basket.
Dollar General is Growing Through the Basket
Dollar General’s traffic story centers on frequency and proximity. Nearly one-quarter of visitors now shop there four or more times per month.
But in 2025, higher visit frequency did not translate into comparable wallet growth. Observed spend increased just 2.5%, while transactions declined 0.7%. But the 2026 story is stronger:
In H1 2026, Dollar General spend grew 5.7%. Transactions increased 2.2%, while average order value rose 3.4%. Average ticket increased from $21.23 in 2024 to $22.32 in the first half of 2026.
Dollar General’s current growth engine isn’t simply the additional trip. It’s the additional item.
The data also reveals an emerging geographic opportunity. Dollar General’s observed spend grew 16.8% in the West, its fastest-growing but smallest region. The retailer known for Southern convenience may be building its next growth frontier farther west.
Why Foot Traffic and Transaction Data Tell Different Stories
Foot traffic data is not wrong. But it is incomplete when viewed on its own.
Across just four retailers, the first half of 2026 produced three distinct divergences:
- Costco gained visits while its wallet momentum plateaued
- Walmart generated double-digit spend growth on the back of a quiet traffic story
- Target’s trips returned before its baskets fully recovered
CPG brands using visit share to size retail channels could overlook the retailer capturing the most incremental spend. Commercial real estate teams evaluating anchors on visitation alone could miss major differences in economic performance. And retailers benchmarking competitors solely on visits cannot distinguish between a rival gaining attention and one gaining wallet share.
Traffic tells you where consumers went. Transaction data tells you what happened next.
How Facteus Sees It
Retail teams do not need more disconnected signals. They need answers that show what changed, why it matters, and where to act. Facteus measures what happens after a shopper walks through the door using actual card transactions from more than 200 million Americans. Our data provides account-level visibility across competitors, regions, generations, and dayparts, with near-real-time insight into changing consumer behavior.
Foot traffic shows which retailers are attracting attention. Transaction data reveals which retailers are converting that attention into economic value.
The strongest view of physical retail comes from putting both signals side by side and following the dollars.
Methodology: Spend, transaction, and average order value figures reflect Facteus observed consumer card spend at Walmart, Target, Costco Wholesale, and Dollar General from June 1, 2023, through June 30, 2026. Year-over-year comparisons use matched calendar periods. Figures represent observed panel spend, not company-reported revenue. Visitation statistics are sourced from Placer.ai’s report, Physical Retail in 2026: How the Giants Are Winning.
See Retail Through the Wallet
Understand where consumers are spending, how behavior is changing, and which competitors are gaining economic momentum with Facteus retail intelligence.