
FIFA projected the 2026 World Cup would add up to $80 billion in global economic output. When the tournament wrapped in July, Bank of America put the real number closer to $40 billion, half the original hype. That gap has become the story everyone’s telling about World Cup economics: big promises, smaller reality, host cities left holding the bag. It’s a tale as old as time.
That story isn’t wrong, but it’s incomplete. Some companies won. Others did not. Those press releases are built on top-down estimates, not on what people actually did with their money. At Facteus, we can do both.
First, we pulled real card spend across a basket of tourism-linked categories: lodging, restaurants, bars, retail, and compared World Cup host cities against the rest of the US during the tournament. Then we went granular, unpacking the behavior of 2,332 individual cardholders identified inside Lumen Field when the US Men’s National Team played Belgium in the Round of 16, to see how money flows through the local economy in real detail.
The macro data confirms host cities got a real, measurable lift. The Lumen data shows exactly who drove it and how fast it moved. Here’s what the transaction record actually says, category by category, card by card. Let’s dig in.
The Full Tournament: Host Cities Outpaced the Rest of the Country by 2x
Across all 43 tournament games, from June 12 through July 20, we compared card spend in World Cup host-city MSAs against every other market in the country, using a basket of categories tied to tourism, hospitality, and fan activity. Two things worth noting about scope: this data reflects domestic card spend only; we’re not capturing international visitors, and it splits cardholders into in-town (within 100 miles of home zip code) and out-of-town, giving us a clean way to isolate travelers from locals in the next section. For now, here’s the headline view across everyone.
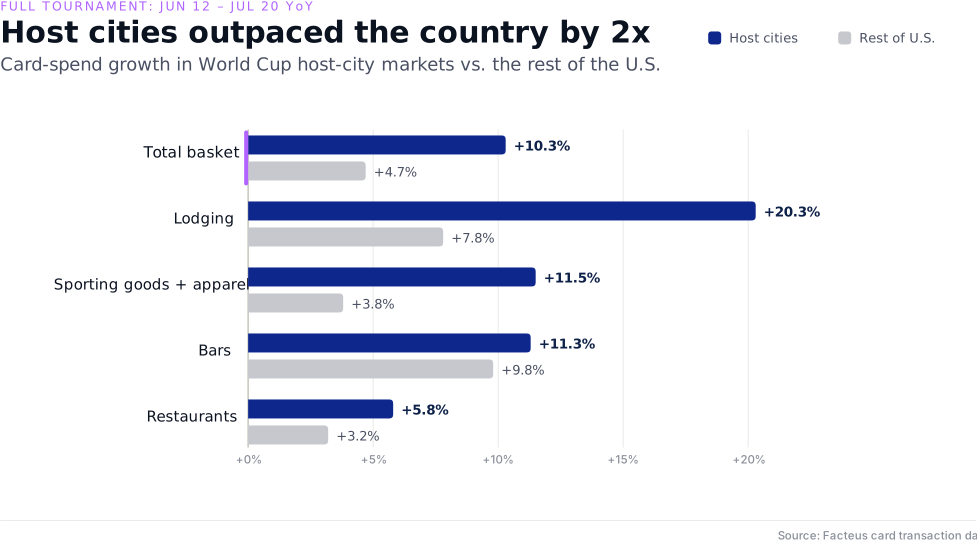
This is the widest lens we have on the data: every host city, the full tournament window, and it already tells the core story before we zoom in any further. Host cities didn’t just grow; they grew at more than double the national rate, and the categories leading that growth, lodging and venue-related spend, hint at exactly where that money ultimately landed.
But an aggregate number like this conflates two very different groups of people: locals who spent a little more because the World Cup was happening in their city, and travelers who packed a bag and flew or drove in for it. That distinction is where American World Cup fever actually shows up in the data, and it’s where we go next.
Americans Got World Cup Fever, and Many of Them Traveled for It
The overall lift in host cities is one story. Who actually drove that lift is another. Splitting the same basket between local and out-of-town cardholders shows that both groups spent more in host cities than in the rest of the country, but the gap is far wider for travelers.
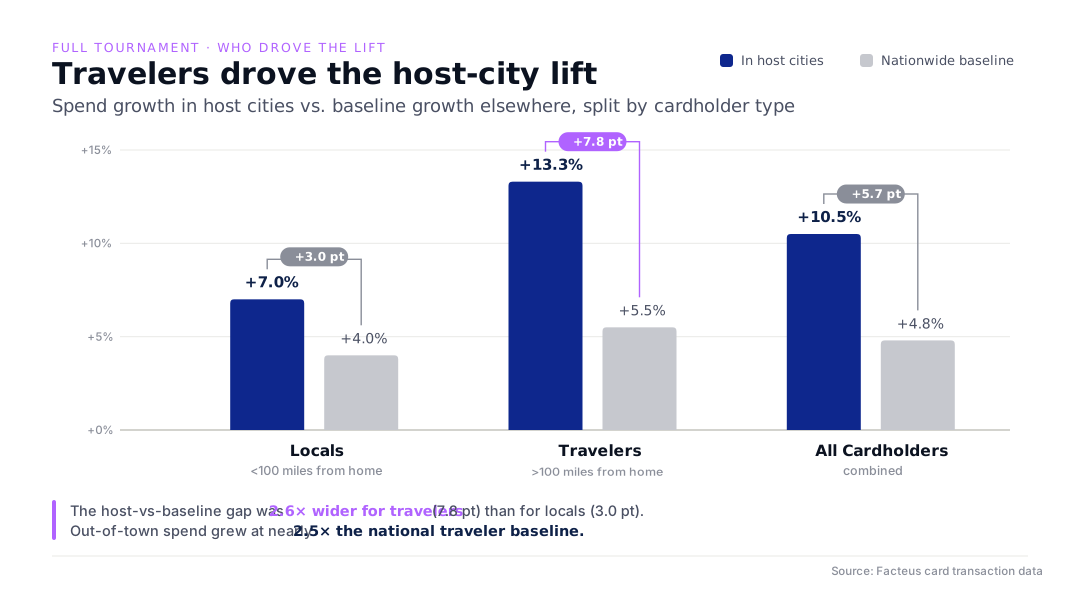
The takeaway is straightforward: locals in host cities did spend more, indicating that plenty of hometown fans caught World Cup fever without leaving home. But the real driver of the lift was travel. Out-of-town spend didn’t just grow. It grew at a rate nearly 2.5X the national baseline for travelers. Americans didn’t just watch the World Cup from home — a meaningful number of them packed their bags and spent real money doing it.
On USMNT Game Days, the Whole Country Watched
Instead of splitting host cities from the rest of the country, this cut looks at the country as a whole across the five specific dates the USMNT played: June 12, June 19, June 25, July 1, and July 6. No city comparison, just America on gameday. The result makes the case on its own: spend jumped nationally in exactly the categories you’d expect if people were gathering to watch, whether they lived in a host city or a thousand miles from the nearest stadium.
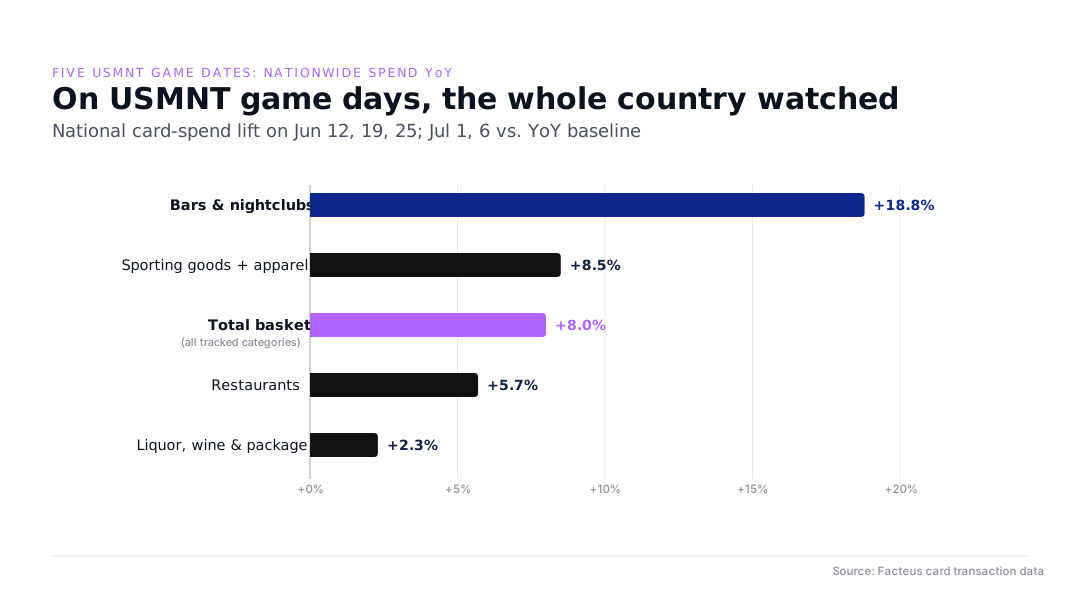
You didn’t need a stadium seat to feel the World Cup. Bars saw their spend jump nearly 19% nationally on these five days alone, and apparel- and venue-related categories moved even more. This wasn’t a host city phenomenon; it was a national one. The tournament pulled people out of their houses and into bars, fan zones, and watch parties across the entire country. USMNT fandom showed up in the data everywhere, not just where the games were being played.
Which is exactly why it’s worth asking what that fandom looked like up close, inside an actual stadium, on the day it mattered most.
Inside Lumen Field: Who Actually Captured the Money
On July 6, the day USMNT lost 1-4 to Belgium and was eliminated, we identified over 2,332 individual cardholders inside Lumen Field based on in-stadium concession purchases. From there, we traced everything else those cards spent on throughout the day.
Tickets and souvenirs alone captured 22% of every dollar this cohort spent on game day, more than any other single category, all of it routed to FIFA-branded merchants rather than local businesses in Seattle.
Within that bucket, thirteen individual purchases averaged over $2,000 each, one as high as $9,873, likely premium hospitality packages, alongside 193 smaller purchases averaging $251, ordinary fans buying jerseys, scarves, and gear. For context, the official adidas match ball alone retails for $170, so a $251 average easily reflects a single souvenir purchase or two
Dining and drinking made up 22.7% of total spend, but fast food outspent sit-down restaurants nearly 3 to 1
Travel and lodging, largely national and international airline and hotel brands, made up another 19.6%
Add it up and FIFA, airlines, and hotel chains combined captured well over 60% of every dollar tracked, before a single fan bought a beer or hopped a bus in Seattle.
The pattern holds at the individual level exactly as it does at the macro level. FIFA sits at the top of the money flow, taking its cut before a fan even walks through the gate. National airlines and hotel chains come next. What’s left for the host city itself shows up mostly in food and transportation, real spend, but a distinctly smaller slice of the pie.
The Bottom Line
The top line number was always going to disappoint someone. $40 billion sounds enormous until you set it against FIFA’s own $80 billion projection, and it barely moves the needle against the size of the US economy. That’s the number that gets the headlines and the “World Cup economics don’t add up” takes.
But card-level data tells a steadier story. Host cities pulled ahead of the rest of the country across the full tournament, and the categories that moved most: lodging, ticketing, and apparel, which are exactly the ones you’d expect if real visitors were spending real money, not just recirculating local dollars. The whole country tuned in for USMNT, whether or not they had a ticket. And zoom into a single stadium on a single elimination day, and you see who actually captured that money first: FIFA, airlines, and hotel chains, well before the host city itself saw a dime.
Aggregate estimates will always be argued over. Transaction data doesn’t leave much room for interpretation. It just shows what happened, and who benefited most from it.
Methodology:
The figures in this piece are drawn from Facteus card transaction data across a panel of active credit, debit, and prepaid cards. A few notes on scope:
- All comparisons are year-over-year against the same calendar dates in the prior year to control for day-of-week and seasonal spending patterns
- “Host cities” refers to the MSAs containing World Cup venues
- The local versus out-of-town split is based on whether a cardholder’s transaction occurred within 100 miles of their home zip code
- This data reflects domestic card spend only. It does not capture spend by international visitors nor cash transactions
- The Lumen Field cohort was identified based on in-stadium concession purchases on July 6 and reflects only spend that posted on that date. Travel, lodging, and tickets purchased in advance of the visit are not captured in these totals.
MCC codes included in this analysis:
- 5812: Restaurants or Eating Places
- 5813: Alcoholic Beverages, Drinking Places, Bars, Nightclubs
- 5814: Fast Food Restaurants
- 5941: Sporting Goods Stores
- 5655: Sports Apparel Stores
- 5921: Liquor, Wine, Package or Beer Stores
- 7941: Commercial/Professional Sports, Promoters, Athletic Fields
- “Lodging” is a rollup category combining hotel chain MCCs (e.g., 7011, 3501-3826)
Get your own macro-to-micro level view of the economy.
Understand where consumers are spending, how behavior is changing, and which competitors are gaining momentum with Facteus.