This quarter, many of the country’s top restaurant brands reported the same headline: sales are down. But if you look at the transaction data, those headlines tell very different stories. One brand lost customers to a nearby rival. Another is gaining new customers quickly but losing existing ones just as fast. And for one brand, customers didn’t go to a competitor. They left the category altogether.
A same-store sales number tells you a brand is up or down. But it doesn’t explain why. And each “why” calls for a different strategic response.
The Question a Comp Can’t Answer
Restaurant Dive’s Q2 scorecard gives a clear picture of the industry. Coffee and steakhouse chains are doing well. Burger King is ahead of other burger brands. Pizza chains are struggling. Wendy’s has now had six straight quarters of declines. As a scoreboard, it’s accurate and answers the first question operators ask: who won and who lost.
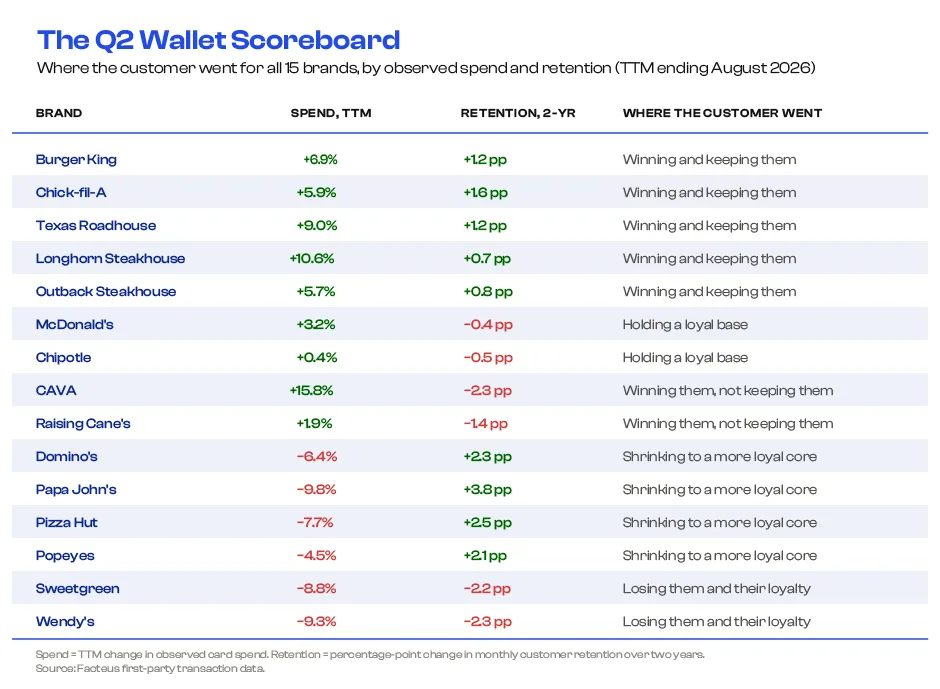
Transaction data answers the next big question: when sales change, where do the customers go? Same-store sales only count dollars at one store. They don’t show if a winning brand keeps its new customers, if a losing brand’s sales went to a competitor or left the category, or if a rival is quietly gaining ground. These are questions about customer behavior. To find the answer, we studied 15 restaurant brands across 5 categories: burger chains, health-focused fast casual, pizza, steakhouses, and chicken. And in Q2, the answers were different for every category.
Sometimes the Customer Migrates to a Competitor
Let’s start with the most straightforward story; the one most people expect. Burger King is having its best quarter in years. So where did those gains come from?
The best place to look is at the biggest customer base in the category: McDonald’s, where all burger brands compete for the same customers. Two years ago, 19.1% of McDonald’s customers also spent at Wendy’s. Now, it’s 16.0%. Meanwhile, the share of customers who also spent at Burger King stayed about the same, near 15%. Wendy’s is losing ground with key burger customers, while Burger King is holding steady.
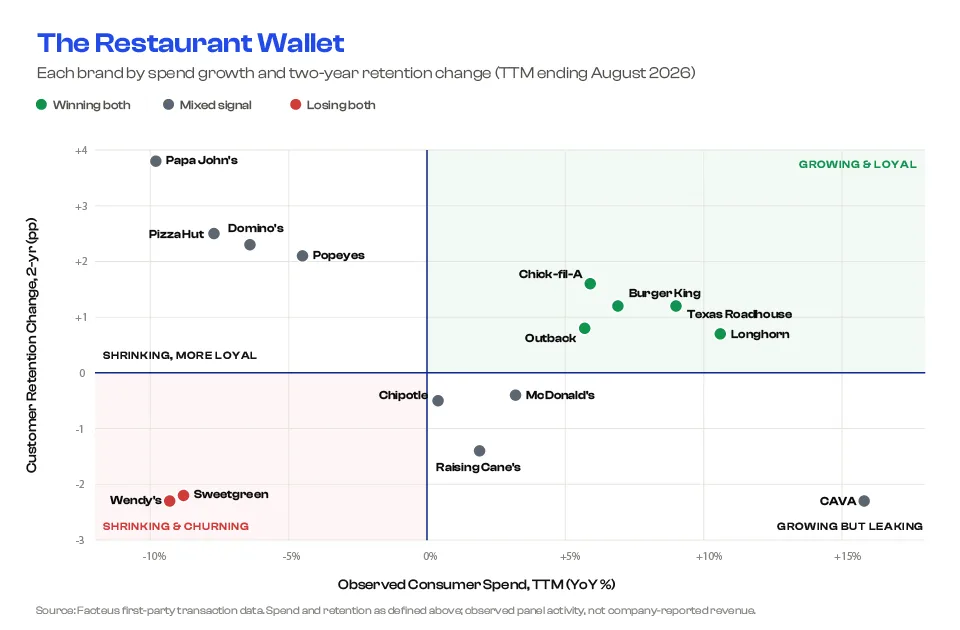
Wendy’s other numbers tell the same story: spending is down 9.3%, transactions are down 13.5%, and customer retention dropped by 2.3 points – the biggest drop among the fifteen brands we analyzed. One detail stands out: Wendy’s average ticket went up almost 5% over the year. So, there are fewer visits but bigger checks. The brand isn’t losing on check size; it’s losing customers, especially among Gen Z and Gen X diners who could shape the category’s future.
This is the obvious case, and sometimes it’s correct. The customer really did switch to a competitor. But this quarter, that’s the exception, not the norm.
Sometimes the Winner Can’t Keep Them
Now for a different story. On paper, CAVA is the clear winner: spending is up 15.8%, the highest of any brand tracked, with growth across all age groups and Gen Z spending up over 20%. If you only looked at the top-line number, you’d call CAVA the healthiest brand in the category.
But the transaction data shows what the top line hides. CAVA’s customer retention dropped by 2.3 points over two years, one of the biggest declines in the group. The brand is bringing in new customers faster than anyone else in fast casual, but it’s also losing them just as quickly. Compare that to Chipotle, which saw only a small increase in spending but keeps 41% of its customers – the highest in the category. CAVA is a fast-growing challenger attracting lots of new guests, while Chipotle is a steady brand with a loyal base.
You can’t see this difference in same-store sales. A strong quarter from new customers and a strong quarter from loyal customers look the same on paper, but they are very different business directions that often age differently over time. Transaction data helps you spot the difference early, which is why it’s important to look beyond the scoreboard.
Sometimes the Whole Category Lets Them Go
Here is the quarter’s most surprising, and arguably most important, result:
Three national pizza brands all saw sales drop over the past year: Domino’s fell 6.4%, Pizza Hut 7.7%, and Papa John’s 9.8%. But all three became more loyal, with retention rising by 2.3, 2.5, and 3.8 points, respectively. So, these brands got smaller but stronger. How?
This happens when the customers leaving aren’t the loyal core, but the occasional buyers. So where did those occasional customers go? For the first time this quarter, the answer isn’t another competitor. Among Domino’s customers, spending at Pizza Hut, Papa John’s, and Little Caesars stayed the same or dropped. Pizza dollars aren’t just moving between big chains. They’re leaving the category altogether. Domino’s decline is mostly among younger, delivery-focused customers, even as older customers spent more. This suggests the occasion is shifting elsewhere, not that a rival is taking sales. Restaurant Dive’s article earlier this month notes that delivery apps are cutting into pizza’s traditional delivery advantage, and the transaction data supports that.
No competitor took these customers. The occasion did. Same-store sales can’t capture this difference, but it matters a lot. Losing customers to a rival is a menu and price issue. Losing the occasion to another channel is a value or access issue. Sales numbers may look the same, but transaction data tells a different story.
And Sometimes Nobody Goes Anywhere
Not every brand is losing customers, and that’s important. Among steakhouses, Longhorn’s spending grew by 10.6% and Texas Roadhouse by 9.0%, and both also improved retention – the ideal combination for any operator. In chicken, Chick-fil-A keeps 49.4% of its customers each month, second only to McDonald’s, and still grew spending by nearly 6%. These brands aren’t losing customers. They win the quarter while keeping the guests who helped them get there. That’s the fourth answer, and the only one that builds over time.
Four Stories with Four Destinations
When you look at all these stories together, the point is clear. Four brands had similar sales changes, but their customers went in very different directions: to a rival, to a brand that can’t keep them, out of the category, or nowhere at all. Same-store sales show the trend, but wallet data shows where customers actually go, so you can manage to it – and that’s what matters most.
How Facteus Sees It
Facteus measures what traditional comps can’t: the customer. With visibility into real-time transactions from more than 200M U.S. consumer cards, across all major restaurant brands, you get insights into retention, cross-shopping, generational cohorts, regions, daypart and more. The quarterly same-store sales scorecard shows who won. The transaction data shows where the customer went – and with Facteus that’s insight you get fast enough to adjust strategy before it’s too late. Winning is just a direction. Knowing who you won from, and if you’ll keep them, is a different kind of intelligence.
Get a clearer view of the restaurant market outside your own four walls.
Understand where consumers are spending, how behavior is changing, and which competitors are gaining momentum with Facteus.
Methodology: Spend, transaction, AOV, retention, and cross-shopping figures reflect Facteus observed consumer card activity for 15 restaurant brands from January 1, 2024 through August 31, 2026. Trailing-twelve-month comparisons measure September 2025 through August 2026 against the prior twelve months. Retention figures are monthly customer retention rates; two-year changes compare matched months to control for seasonality. Cross-shopping measures the share of an anchor brand’s customers who also transacted at a named competitor in the same month. Figures represent observed panel activity, not company-reported revenue. Same-store sales and traffic figures referenced are company-reported metrics as compiled in Restaurant Dive’s September 1, 2026 analysis, “Q2 restaurant winners and losers.” The data can show correlation between competitive dynamics and spending trajectories; causation requires context beyond the dataset alone.